
Analysis of Salary Growth Rate assumption adopted by NSE 50 Companies (FY24 and FY25)
Salary growth rate is one of the most important assumptions made while performing actuarial valuation of salary based employee benefit schemes, such as gratuity, earned leaves, pensions etc. Its significance can be understood from the fact that even a 1% (absolute) change in the year-on-year salary growth rate assumption can easily change the overall liability value by 5% to 10% (absolute).
In addition, the salary growth rate assumption often tends to be a point of discussion and debate between the auditors and the management, with auditors challenging the appropriateness of this assumption based on the actual salary growth rates awarded over the last few years.
As actuarial consultants providing advice and actuarial valuation services, we often receive request from our clients and their auditors to provide benchmarks against which they can validate their actuarial assumptions, in particular the salary growth rate assumption. To facilitate this, we undertake an annual review of the salary growth rate assumption adopted by NSE 50 companies. This article highlights our analysis for FY 2024-25 along with comparatives for past few FYs. The analysis for previous financial years can be found here:
Analysis of Salary Growth Rate assumption adopted by NSE 50 Companies (FY23 and FY24)
Analysis of Salary Growth Rate assumption adopted by NSE 50 Companies (FY22 and FY23)
Analysis of Salary Growth Rate assumption adopted by NSE 50 Companies (FY21 and FY22)
Analysis of Salary Growth Rate assumption adopted by NSE 50 Companies (FY20 and FY21)
As part of our analysis, we have also drawn out the relative movement between the salary growth rate assumption and the discount rate. Theoretically, both the salary growth rate as well as discount rate assumption are closely linked to the long term expectation of inflation in the economy and hence should be positively correlated. As such, studying the two movements together helps in assessing the consistency of the assumptions as well as assess the net strengthening / weakening of the overall salary growth rate assumption.
Why NSE 50 Companies?
The companies considered for this research are amongst the largest corporate houses in India. They are also amongst the ones which get audited by the leading audit firms in the country. It is therefore reasonable to expect the practices adopted by these companies to be amongst the best in their respective industries.
Before looking at the findings below, it should be noted here that during FY 2024-25, the composition of the Nifty 50 index changed with four companies (viz Bharat Petroleum Corporation Ltd., Britannia Industries Ltd., Hero MotoCorp Ltd., and IndusInd Bank Ltd.) which were part of index as at 31 March 2024 but were replaced by Eternal Ltd., InterGlobe Aviation Ltd., Jio Financial Services Ltd. and Max Healthcare Institute Ltd. in the index as at 31 March 2025. The findings below are based on the Companies that comprised the index as on 26th February 2026.
Overview of the findings
The below chart shows the average salary growth rate and the average discount rate of the NSE 50 companies along with the 10 year and 5 year Government bond yields over the last two financial years (i.e. FY 2023-24 and FY 2024-25):
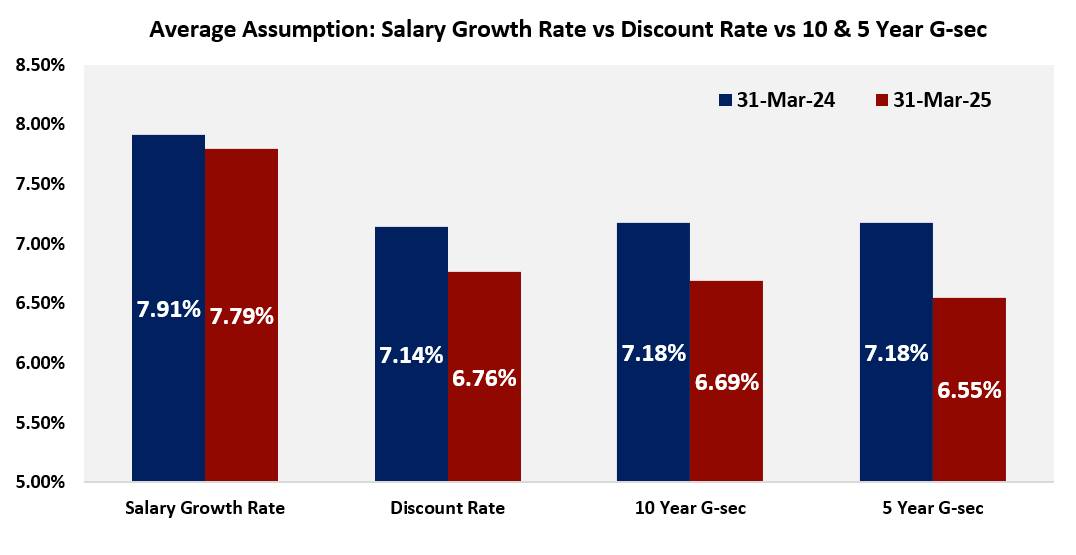
Source: Annual reports of various companies and www.investing.com. The details captured for each company can be accessed by clicking here. Further, note that average assumptions shown above reflect a simple average of the assumptions across different companies.
Following are the main findings of our analysis:
- As can be observed from the above chart, the absolute level of average salary growth rate assumption for NSE 50 Companies has decreased marginally during FY 2024-25 (being 7.91% p.a. as at 31 March 2024 vs 7.79% p.a. as at 31 March 2025).
- Whilst majority of the companies maintained their salary growth rate assumption at same levels for both the financial years, only 4 companies were observed to have strengthened their salary growth rate assumption during FY 2024-25, whereas 9 companies were observed to have lowered their salary growth rate assumption during FY 2024-25.
- The average discount rate assumption has decreased during the period (being 6.76% p.a. as at 31 March 2025 vs 7.14% p.a. as at 31 March 2024). The decrease is driven by the fall in yields on government bonds of different tenors as compared to the yields observed at the end of 31 March 2024. As a reference, we note that the benchmark yield on 10-year government bond and 5-year government bond has decreased by about 49 bps and 63 bps respectively. You can access our discount rate article for 31 March 2025, which also gives comparison of yields on government bonds, by Clicking Here
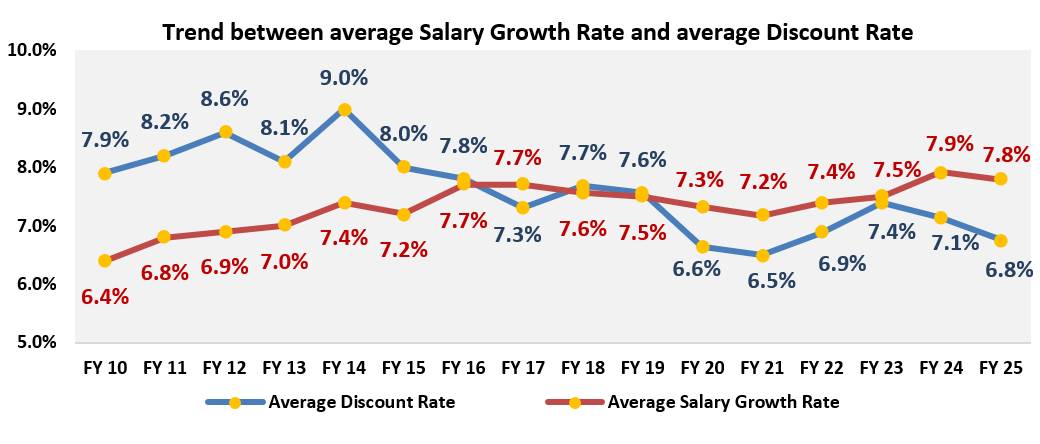
- Over a relatively long period, we observe consistent strengthening of the average salary growth rate assumption (on both absolute as well as relative to discount rate basis). The chart below summarizes the average salary growth rate and discount rate assumption adopted by NSE 50 companies since FY2010:
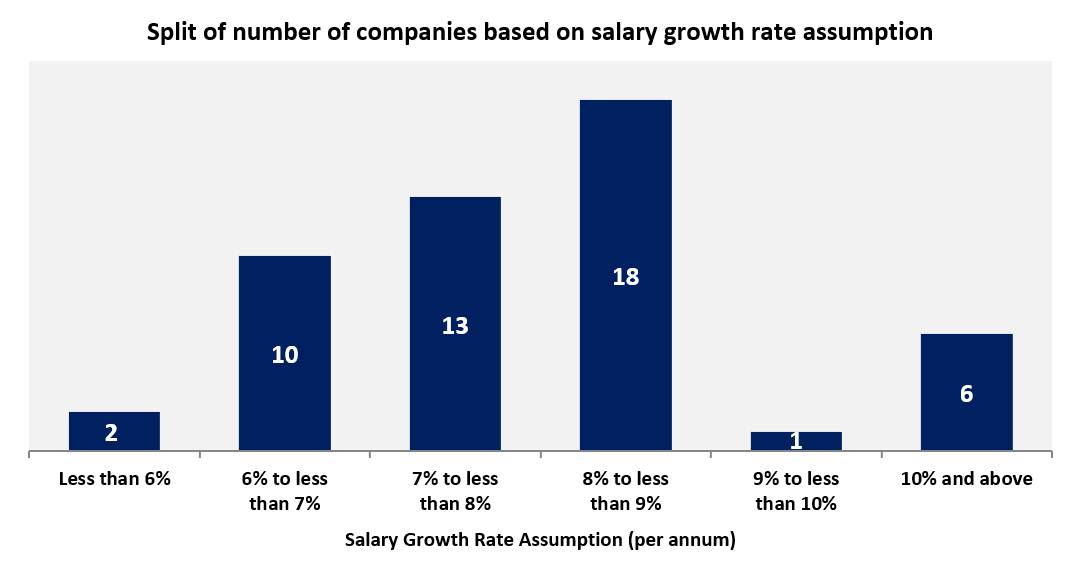
- The minimum salary growth rate assumption observed was 5.50% p.a. whereas the maximum was observed to be 13.00% p.a. as at the end of FY 2024-25. The following chart shows the split of number of companies based on the range of the salary growth rate assumption as at 31 March 2025:

- Majority of companies have used a single salary growth rate assumption across employees and future years of service. However, 5 companies used varying assumption for different categories of employees, and 3 companies varied the assumption by year of projection. This has been discussed in more detail below.
Application of Salary Growth Rate assumption
As mentioned above, the general trend is to use a single assumption for salary growth rate in their valuation (e.g. assumption of 7.50% per annum for all future projection years and for all category of employees). However, companies could consider varying the assumption on the following basis:
-
Varying Salary Growth Rate by year of projection: It means assuming a different salary growth rate for short term and long term. For example, the salary growth assumed can be 10.00% p.a. for first 3 years of projection and 8.00% p.a. thereafter. As indicated above, 3 NSE 50 companies (HDFC Life Insurance Company Ltd., Nestle India Ltd and SBI Life Insurance Company Ltd.) have adopted this approach as at 31 March 2025.
This approach has the advantage of reflecting the currently higher (or lower) actual salary growth rates as well as the structural view of the Company over the long term. This approach also tends to help build consensus with the auditors who may be challenging the salary growth rate assumption based on the actual salary growth rates awarded over the last two to three years.
You can refer to one of our earlier articles on this approach by Clicking Here
-
Varying Salary Growth Rate by category of employees: In this case, the salary growth rate assumption is varied basis the category of employees. For example, employees may be classified as senior management, middle management and non-management employees and a different rate of salary growth may be assumed for each category. As indicated above, 5 NSE 50 companies (Coal India Limited, HDFC Life Insurance Company Ltd., InterGlobe Aviation Ltd., Kotak Mahindra Bank Ltd. and Tata Consumer Products Ltd.) have adopted this approach as at 31 March 2025.
Doing so helps the organization in setting a more realistic liability as generally, it is seen that the increase in the salary tends to vary by the category of employees.
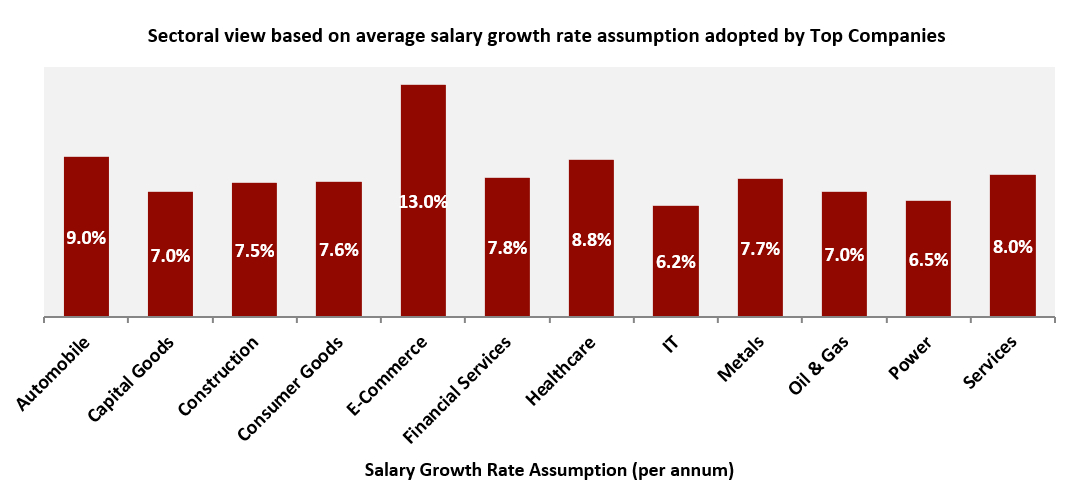
Sectoral Highlight
The chart below depicts the average salary growth rate assumption adopted as at 31 March 2025 by some major sectors covered by NSE 50 Companies. E-Commerce stands out with a leading growth rate of 13.00% p.a., while IT sector has opted for the minimum rate of 6.20% p.a.
Concluding Thoughts
- The analysis for FY 2024–25 reflects a phase of moderation in salary growth rate assumptions adopted by companies forming part of the NSE 50, with the average assumption declining marginally compared to the previous year.
- Despite the slight reduction in the absolute salary growth rate, the sharp decline in discount rates has led to a relative strengthening of the net liability position. This highlights the importance of assessing salary growth and discount rate assumptions together.
- As per Para 78 of Ind AS 19, actuarial assumptions should be mutually consistent and reflect underlying economic relationships such as inflation, salary growth, and discount rates. Since both salary growth and discount rates are linked to long-term inflation expectations, they are generally expected to move in a positively correlated manner; such consistency helps offset their impact on liabilities and reduces volatility arising from changes in the discount rate alone.
- Over the long term since FY2010, the structural trend continues to indicate strengthening of salary growth assumptions, suggesting alignment with evolving compensation practices and inflation expectations.
- Salary growth rates differ widely across industries and organizations as they are driven by multiple factors. To reflect these future trends more accurately organizations may adopt assumptions that consider variations across employee categories and projection periods.
We hope you find the analysis helpful. I thank you for reading this note and welcome any comments or recommendations or observations you may have on the subject. You can direct those to the email address mentioned below.
Surbhi Jindal
Associate Vice President- Actuarial
KP Actuaries and Consultants LLP
s.jindal@kpac.co.in
www.kpac.co.in
Disclaimer: The above information has been furnished solely for information and must not be reproduced or redistributed. This material is only for the information of the reader and we are not soliciting any action based upon it. Please note that this article does not, in any manner whatsoever, constitute any professional recommendation or advice. In particular, the information contained in this document is for general purposes only and is not an advice on actuarial valuations or investments or anything else. The information given above is in summary form and does not purport to be complete. We have reviewed the above and in so far as it includes information or facts available in the public domain, it is believed to be reliable though its accuracy or completeness cannot be guaranteed. The information contained in the above report should be construed as non-discretionary in nature and the recipient of this material should rely on their own investigations and take their own professional advice. Neither KP Actuaries and Consultants LLP nor any person connected with it accepts any liability arising from the use of this email or document linked therein. The recipient(s) before acting on any information herein should make his/her/their own investigation and seek appropriate professional advice and shall alone be fully responsible / liable for any action or decision taken on the basis of information contained herein.