
Attrition Rates and Impact on End of Service Benefit Liabilities
Results of actuarial valuations of employee benefits are going to be only as much valid as the assumptions and therefore, enough attention should be paid towards the selection of assumptions used in the actuarial valuations. Attrition rate, among other assumptions, is one of the important assumptions made while performing actuarial valuation of salary-based employee benefit schemes, such as End of Service Benefit (EOSB) offered in the Kingdom of Saudi Arabia (KSA), United Arab Emirates (UAE) and other countries in the region.
In this article, we discuss how attrition rates can influence the value of liability and thus how a better analysis of attrition rates can help in managing costs and optimizing liabilities.
In our previous article, we discussed the ‘Key considerations in EOSB valuations’ in which we focused on the 4 primary aspects that shall ensure the valuation results are appropriate, justifiable and in accordance with the requirements of the applicable accounting standard. You can access that article by clicking here.
Background
We often come across with clients in the KSA, UAE and other countries in the region, who ask us to consider a single attrition rate in their actuarial valuations e.g. 10% p.a. for all kinds of employees. Whilst this rate may reflect the aggregate level of attrition rate experienced by the company, it may not be the most efficient way of reflecting attrition in actuarial valuations. We believe that a bit of data analytics could help the companies better reflect the economic realities in the valuation of the liability.
However, before we go further into the best approach to analyse and consider attrition rate in actuarial valuation of employee benefit schemes, let us understand the general relationship between attrition rates and the consequent value of the liability.
Attrition Rates and End of Service Benefit Liability
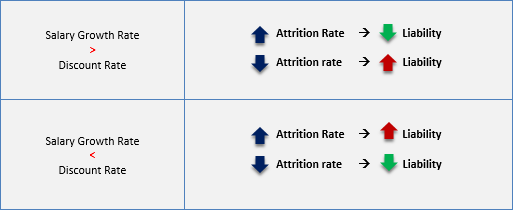
Attrition rates determine the timing of payout of liability i.e. whether the benefit payout will happen earlier or later during the projection period. A lower attrition rate will mean a longer payout period for the liability and vice versa. And as we know, longer the payout period, lower will be the liability if the salary growth rate assumption is lower than the discount rate. Conversely, a longer payout period will result in a higher liability if the salary growth rate assumption is higher than the discount rate.
The following chart summarizes the general relationship between the present value of obligation and attrition rates considered in the valuation:
There are, however, exceptions to the above general rule, which include, for example:
- In case of young organizations, due to vesting criteria (2 years) and an increasing scale of benefit (depending up on the years of service), higher attrition rate could result in a lower liability even when salary growth rate is less than the discount rate. This is because higher attrition will mean more people will leave the organization before completion of 2 years (vesting criteria) or before the high level of benefit becomes applicable.
- Due to lower benefit entitlement ratio in event of resignation / withdrawal up to a certain length of service, higher attrition rate may result in a lower liability even though salary growth rate is less than discount rate. This is because higher attrition will mean people will receive 1/3rd or 2/3rd of their retirement benefit depending upon the services rendered by them.
Overall, which impact will dominate and what will be the impact on liability of any change in attrition rate will depend on which of the above factor dominates.
Analyzing Attrition Rate for Actuarial Valuations
Given that the attrition rates can impact the value of liability significantly, there is a case of for the companies to analyse their attrition rates and reflect them correctly in the valuation. There can be various approaches to analyse attrition rates e.g. how do attrition rates vary by age, by number of years of service, by category of employees (e.g. management and non-management staff or workers), by geography, by department, etc.
We believe that, from actuarial valuations perspective (in particular, in case end of service benefit valuation for companies in KSA), it may work better if the Company can analyse its attrition rates by years of service. This is because the benefit entitlement increases with an increase in service years and because the attrition rates are generally observed to be lower in case of employees who have spent more years in the organization compared to those who are within first few years of their employment with the organization.
The following table summarizes the increasing benefit scale for End of Service Benefit offered in the Kingdom of Saudi Arabia (KSA):
| Length of service | Benefit on normal retirement | Entitlement ratio in event of resignation |
| Less than 2 years | 15 days salary for each completed year | Nil |
| 2 to 5 years | 15 days salary for each completed year | 1/3rd of benefit on normal retirement |
| 5 to 10 years | For first 5 years: 15 days salary for each completed year; and For remaining service: 30 days salary for each completed year | 2/3rd of benefit on normal retirement |
| Above 10 years | For first 5 years: 15 days salary for each completed year; and For remaining service: 30 days salary for each completed year | Same as benefit on normal retirement |
Thus, rather than using a single rate, it may be more appropriate for a Company, based on their past experience, to use a higher attrition rate for employees within first 2 years of service than employees who have completed 2 years but less than 5 years of service. Similarly, the company could use higher attrition rates for employees who have completed 5 years of service but less than 10 years of service than employees who have completed 10 years of service. This will help the companies better reflect the proportion of employees who exit the organization before becoming entitled to any EOS benefit or before becoming entitled to the full EOS benefit. To the extent the employees are not expected to complete the vesting criteria, the value of the EOS benefit liability will be optimized. Similarly, to the extent the employees are not expected to complete certain service years (e.g. 10 years) which are required for the full benefit entitlement, liability (and consequently expenses) shall be optimally recognised even for the projected resignations / withdrawals.
The same is also in line with the requirements of para 72 of IAS 19 Employee Benefits (IFRS), which reads as under:

“Employee service gives rise to an obligation under a defined benefit plan even if the benefits are conditional on future employment (in other words they are not vested). Employee service before the vesting date gives rise to a constructive obligation because, at the end of each successive reporting period, the amount of future service that an employee will have to render before becoming entitled to the benefit is reduced. In measuring its defined benefit obligation, an entity considers the probability that some employees may not satisfy any vesting requirements. Similarly, although some postemployment benefits, for example, post-employment medical benefits, become payable only if a specified event occurs when an employee is no longer employed, an obligation is created when the employee renders service that will provide entitlement to the benefit if the specified event occurs. The probability that the specified event will occur affects the measurement of the obligation, but does not determine whether the obligation exists.â€
Let us consider the above assertion through a simple worked example.
Simple Worked Example
Let us consider an actuarial valuation of EOSB (as applicable in the Kingdom of Saudi Arabia) of an organization with the data and assumptions:
| Number of employees | 200 |
| Retirement Age | 60 years |
| Monthly Salary | SAR 10,000 (for simplicity, assumed to be the same for all employees) |
| Average Past Service | For first 50 employees: 1 year, for next 50 employees: 3 years, for other 50 employees: 7 years and for remaining 50 employees: 12 years |
| Average Age | 35 years (for simplicity, assumed to be the same for all employees) |
| Salary Growth rate assumption | 3.00% per annum |
| Discount rate assumption | 4.50% per annum |
Let us now look at the liability (i.e. the present value of obligation) under two different attrition rate assumptions:
- Assumption 1: Flat attrition rate of 10% for all ages.
- Assumption 2: Attrition rate varying by completed years of service, i.e. 16% for service below 2 years and 12% for service more than 2 years but less than 5 years, 8% for service more than 5 years but less than 10 years and 4% for service years more than 10 years.
Both the above assumptions could be considered correct as the organization can be experiencing attrition rate of 10% at an aggregate level. However, when looked at based on years of service, older employees (i.e. who have completed, say, 10 years within the organization) may be exhibiting a lower tendency to leave compared to employees who are new to the organization. This may be true because employees who have spent long years in an organization may feel settled within the organization and thus may have a lower propensity to leave.
From an actuarial valuation perspective, for the given salary growth rate and discount rate, Assumption 2 gives a lower liability compared to Assumption 1. The same can be seen in the chart below, which gives comparison of the liability (present value of obligation) for the two different assumptions for attrition rates.
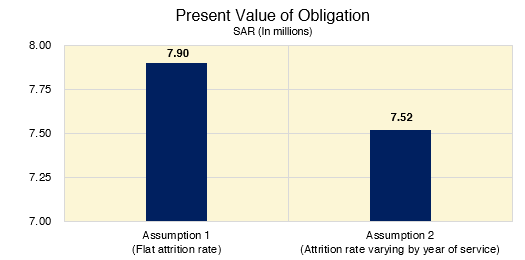
Given the above difference in liabilities, it can be argued that Assumption 2 is a more appropriate and efficient method of reflecting the attrition rates in actuarial valuation of end of service benefit.
Please note that the movement in the liability based on Assumption 2 could have been reverse (i.e. liability would have been higher) if the salary growth rate were to be higher than the discount rate. For example, if the salary growth rate were to be 6%, the liability on a flat attrition rate assumption of 10% would have been SAR 10.55 million. The same would have increased to SAR 11.94 million if the attrition rates were chosen to vary by years of service (i.e. Assumption 2 above).
Other Considerations
Overall, it is advisable for companies to move away from use of a single attrition rate assumption for all employees and analyse attrition rates by factors that have a significant bearing on the actual attrition rates experienced by the Company. One such way to analyse attrition rates is by years of service, which may help the companies put a more appropriate value to their liabilities.
However, it should be noted that any such analysis has its own set of limitations. For example, it may be constrained by availability of data. Further, a more efficient determination of liability will not always result in a reduction in liability and expenses. It may well be the case that a better reflection of underlying experience actually results in an increase in liability and expenses. Also, for companies reporting results in IFRS / IAS 19, the impact of change in attrition rate for post-employment benefit plans (such as end of service benefit) will be routed through the Other Comprehensive (OCI) and not through the Income Statement.
Concluding Thought
This article highlights the fact that there can be ways of effectively managing your costs / liabilities, where the company has not adopted an appropriate ALM strategy. Whilst each approach can have implementation challenges and considerations to be borne in mind, it is essential that the companies move away from an approach of ‘year-end compliance’ to ‘active management of employee benefit liabilities’, which could mean a significant difference to their reported expenses.
I thank you for reading this note and welcome any comments or recommendations or observations you may have on the subject. You can direct those to the email address mentioned below.
Khushwant Pahwa, FIAI, FIA, B Com (H)
Founder and Consulting Actuary
KPAC (Actuaries and Consultants)
k.pahwa@kpac.co.in
www.kpac.co.in
Disclaimer: The above information has been furnished solely for information and must not be reproduced or redistributed. This material is only for the information of the reader and we are not soliciting any action based upon it. Please note that this article does not, in any manner whatsoever, constitute any professional recommendation or advice. In particular, the information contained in this document is for general purposes only and is not an advice on actuarial valuations or investments or anything else. The information given above is in summary form and does not purport to be complete. We have reviewed the above and in so far as it includes information or facts available in the public domain, it is believed to be reliable though its accuracy or completeness cannot be guaranteed. The information contained in the above report should be construed as non-discretionary in nature and the recipient of this material should rely on their own investigations and take their own professional advice. Neither KP Actuaries and Consultants nor any person connected with it accepts any liability arising from the use of this email or document linked therein. The recipient(s) before acting on any information herein should make his/her/their own investigation and seek appropriate professional advice and shall alone be fully responsible / liable for any action or decision taken on the basis of information contained herein.