
ESOP Valuation: Analysis of Expected Volatility Assumption
Accounting for Employee Stock Option Plans (ESOPs) requires determination of fair value of options granted using various option pricing models, such as the Black-Scholes, Binomial or Simulation model. Expected volatility is one of the key and arguably the most material assumption used in option pricing. It is a measure of the amount by which the share price of the Company is expected to fluctuate during a given period.
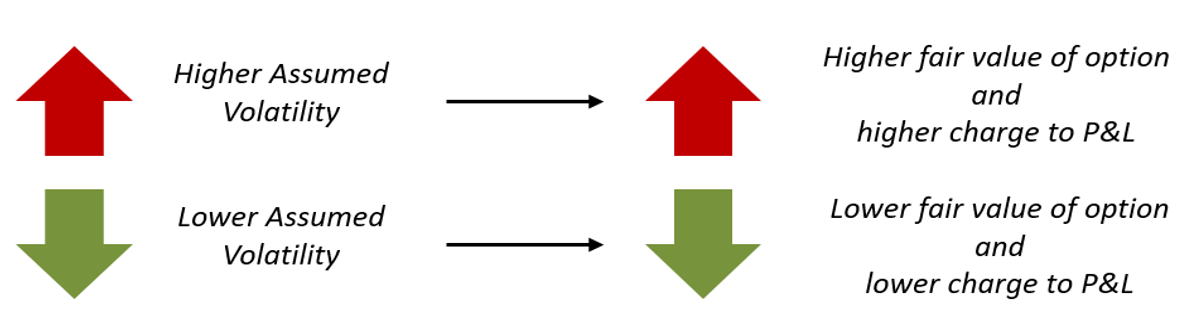
All else being the same, higher expected volatility will result in higher option price and consequently higher income statement charge. Conversely, lower expected volatility will result in lower option price and hence, lower income statement charge.
The materiality of this assumption coupled with the analysis required under IND AS 102 often results in higher scrutiny of this assumption by both management and auditors. In this respect, we at KPAC have carried out analysis of latest reported expected volatility assumption encompassing more than 30 companies listed between 2021 to 2023 with market capitalization in range of INR 2,000 Crores to INR 35,000 Crores. This article highlights our findings on expected volatility assumption of chosen sample set and also discusses the relevance of the findings in setting expected volatility assumption for listed as well as private companies.
We believe this article will be useful for all finance professionals as well as auditors dealing with ESOP accounting as part of their work.
Expected Volatility Assumption: Data Set and Key Findings
Data Set: We have analyzed the expected volatility assumption reported as on 31st March 2023 for 33 listed companies, identified on following basis:
- Listed between 2021 to 2023, to focus the analysis on relatively recently listed companies which are expected to have more active ESOP Programs;
- Market capitalization in range of INR 2,000 Crore to INR 35,000 Crore to give a reasonable data set encompassing small, medium and large cap segments; and
- Coverage across sectors such as banking, healthcare, IT, logistics, fintech etc. to avoid any sector specific trends from impacting the overall analysis.
Note that our analysis focused on the assumption corresponding to the most recent grant date provided in the annual reports of the Companies.
Key Findings: The key findings from our analysis are summarized below:
- Median Expected Volatility of 41%: Overall median expected volatility of the chosen data set was found to be 41% with average expected volatility being 38%. The range of first quartile and third quartile of expected volatility assumption spanned between 27% and 46%. Whilst the expected volatility in share price varies significantly from entity to entity, we note that the median volatility of around 40% also corresponds with the median volatility seen for private sector companies (based on our internal database).
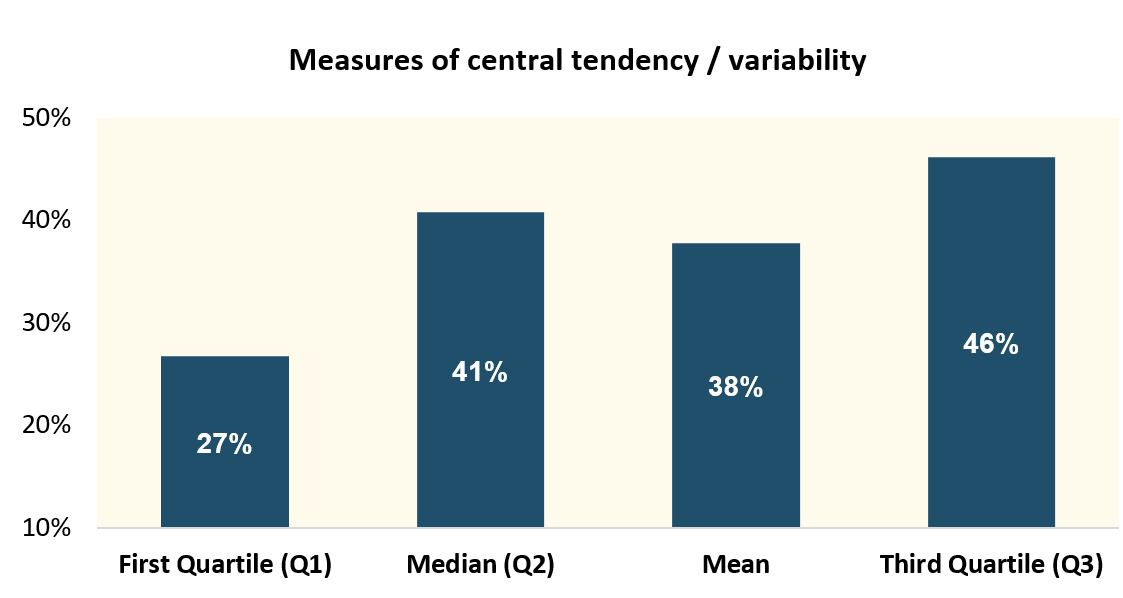
Given above as well as the general concentration of assumption around 40%, we believe it may be a good starting benchmark for setting this assumption, which can then be adjusted upwards or downwards for company specific factors, market data, other IND AS 102 considerations etc.
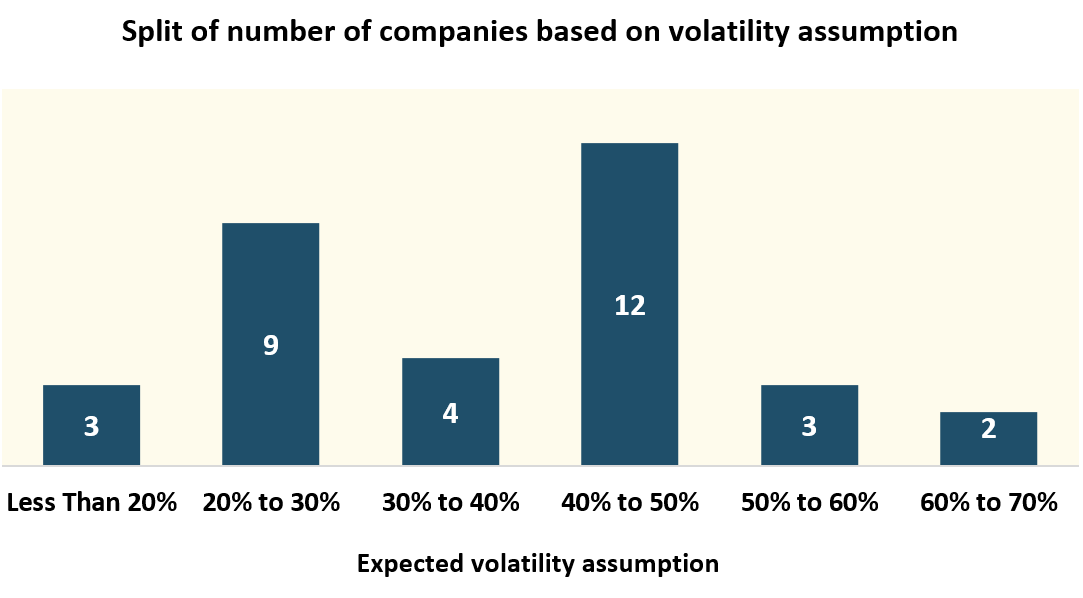
- 65% of companies have expected volatility assumption of more than 30%: The below chart shows the split of number of companies based on the range of the volatility assumption considered. As can be seen, around two-third companies have expected volatility assumption of more than 30% whilst 50% of companies have volatility assumption of 40% or more.

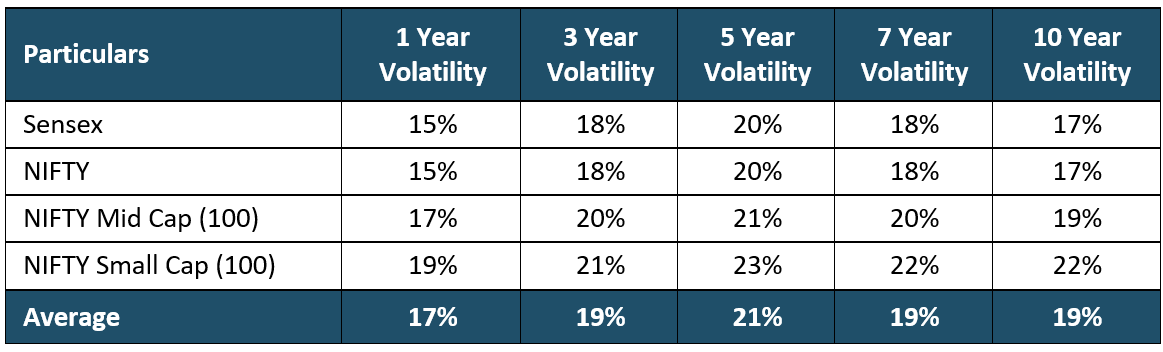
- Expected volatility much higher than volatility of indices: We also analyzed the volatility of different indices over the past 1, 3, 5, 7 and 10 years and noted that the same tended to be in the range of 15% to 23% (refer table below). It should be noted that individual stock volatility tends to be higher than that of indices, which is reflected in the median volatility assumption of 41% seen from the data set.
Relevance and Concluding Thoughts
IND AS 102 requires setting volatility assumption based on, amongst other things, market data for both listed as well unlisted companies. And whilst companies will use their (or their peers’) market data in determining the expected volatility assumption, we believe that the analysis presented above can be used to benchmark the assumption. This can help the companies assess whether their chosen assumption is close to the:
- Median expected volatility assumption of 41%; or
- Lower or upper end of the range seen in the market, in which case, there may be a need to review the assumption for its reasonableness.
Such analysis may be particularly helpful for unlisted companies where at times direct listed comparable companies are not available and often judgements are required to be made based on the expected volatility of companies in same or similar sector.
Please refer our article on volatility assumption for more details on requirements of IND AS 102:
https://www.kpac.co.in/pdf/Determining-Volatility-Assumption-v2.pdf
We hope you find the analysis helpful. I thank you for reading this note and welcome any comments or recommendations or observations you may have on the subject. You can direct those to the email address mentioned below.
Surbhi Jindal
Associate Vice President- Actuarial
KP Actuaries and Consultants LLP
s.jindal@kpac.co.in
www.kpac.co.in
Disclaimer:The above information has been furnished solely for information and must not be reproduced or redistributed. This material is only for the information of the reader and we are not soliciting any action based upon it. Please note that this article does not, in any manner whatsoever, constitute any professional recommendation or advice. In particular, the information contained in this document is for general purposes only and is not an advice on actuarial valuations or investments or anything else. The information given above is in summary form and does not purport to be complete. We have reviewed the above and in so far as it includes information or facts available in the public domain, it is believed to be reliable though its accuracy or completeness cannot be guaranteed. The information contained in the above report should be construed as non-discretionary in nature and the recipient of this material should rely on their own investigations and take their own professional advice. Neither KP Actuaries and Consultants LLP nor any person connected with it accepts any liability arising from the use of this email or document linked therein. The recipient(s) before acting on any information herein should make his/her/their own investigation and seek appropriate professional advice and shall alone be fully responsible / liable for any action or decision taken on the basis of information contained herein.