
Analysis of Salary Growth Rate assumption adopted by NSE 50 Companies (FY17 and FY18)
Salary growth rate is one of the most important assumptions made while performing actuarial valuation of salary based employee benefit schemes such as gratuity, earned leaves, pensions etc. Its significance can be understood from the fact that even a 1% (absolute) change in the year-on-year salary growth rate assumption can easily change the overall liability value by 5% to 10% (absolute).
In addition, the salary growth rate assumption often tends to be a point of discussion and debate between the auditors and the management, with auditors challenging the appropriateness of this assumption based on the actual salary growth rates awared over the last few years.
As actuarial consultants providing advice and actuarial valuation services, we often receive request from our clients and their auditors to provide benchmarks against which they can validate their actuarial assumptions, in particular the salary growth rate assumption. To facilitate this, we undertake an annual review of the salary growth rate assumption adopted by NSE 50 companies. This article highlights our analysis for FY 2017-18 along with comparatives for FY 2016-17. The analysis for previous financial years can be found here:
http://www.kpac.co.in/kc/29/salary-growth-rate:-what-are-nse-50-companies-assuming.html
Â
As part of our analysis, we have also drawn out the relative movement between the salary growth rate assumption and the discount rate. Theoretically, both the salary growth rate as well as discount rate assumption are closely linked to the long term expectation of inflation in the economy and hence should be positively correlated. As such, studying the two movements together helps in assessing the consistency of the assumptions as well as asses the net strengtheing / weakining of the overall salary growth rate assumption.
Why NSE 50 Companies?
The companies considered for this research are amongst the largest corporate houses in India. They are also amongst the ones which get audited by the leading audit firms in the country. It is therefore reasonable to expect the practices adopted by these companies to be amongst the best in their respective industries.
Before looking at the findings below, it should be noted here that during FY 2017-18, the composition of the Nifty 50 index changed and four companies (viz. Ambuja Cements Limited, Aurobindo Pharma Limited, Bosch Limited and Lupin Limited) which were part of index as at 31 March 2017 were replaced by Bajaj Finserv Limited, Grasim Industries Limited, JSW Steel Limited and Titan Company Limited in the index as at 31 March 2018. The findings below are based on the Companies that comprised the index as on 31 March 2018.
Further, note that the salary growth rate assumption of two companies (out of 50) was not readily available from their annual report and as a result the findings in this article are based on the salary growth rate of the remaining 48 companies.
Overview of the findings
The below chart shows the average salary growth rate and the average discount rate of the NSE 50 companies along with the 10 year Government bond yields over the last two financial years (i.e. FY 2016-17 and FY 2017-18):
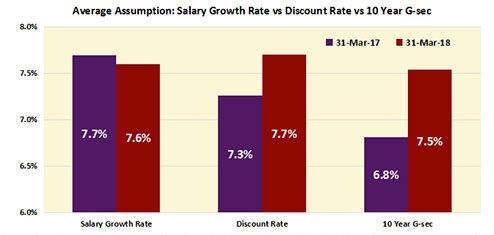
Source: Annual reports of various companies and www.investing.com. The details captured for each company can be accessed by clicking here. Further, note that average assumptions shown above reflect a simple average of the assumptions across different companies.
Following are the main findings of our analysis:
- As can be observed from the above chart, the absolute level of average salary growth rate assumption for NSE 50 Companies has remained largely unchanged between FY 2016-17 and FY 2017-18 (being 7.6% p.a. as at 31 March 2018 vs 7.7% p.a. as at 31 March 2017).
Whilst majority of the companies maintained their salary growth rates at same levels during the two financial years, 6 companies were observed to have strengthened their salary growth rate assumption during FY2017-18 whereas 8 companies were observed to have lowered their salary growth rate assumption during FY2017-18.
- From a relative perspective, we note that whilst the average of salary growth rate assumption has remained largely unchanged, the average discount rate assumption has increased by about 40 bps, from 7.3% p.a. as at 31 March 2017 to 7.70% p.a. as at 31 March 2018. This increase is primarily driven by the rise in yields on government bonds of different tenors. As a reference, we note that the yield on benchmark 10-year government bond increased by about 70 basis points during FY2017-18. Thus, from a relative movement perspective, the average salary growth rate assumption for FY 2017-18 may be considered to have marginally weakened given the increase in discount rate during the period.
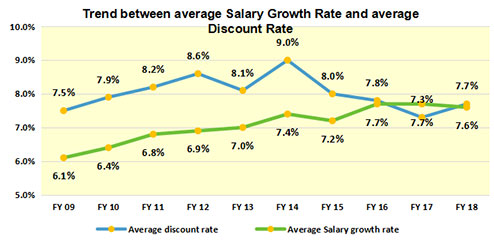
Over a relatively longer period though, we observe the average salary growth rate assumption to have strengthened (on both absolute as well as relative to discount rate basis). The below chart summarizes the average salary growth rate and discount rate assumption adopted by NSE 50 companies since FY2009:

- The minimum salary growth rate assumption was observed to be 5% p.a. whereas the maximum was observed to be 12% p.a. as at FY 2017-18. The following chart shows the split of number of companies based on the range of the salary growth rate assumption as at 31 March 2018:

- Majority of the companies used a single salary growth rate assumption across employees and future years of service. However, 3 companies used varying assumption for different category of employees and 3 companies varied the assumption by year of projection. This has been discussed in more detail below.
Application of Salary Growth Rate assumption
As mentioned in the Overview section, the general trend is to use a single assumption for salary growth rate in their valuation (e.g. assumption of 7.5% per annum for all future projection years and for all category of employees). However, companies could consider varying the assumption on the following basis:
- Varying Salary Growth Rate by year of projection
Varying salary growth rate assumption by year of projection means assuming a different salary growth rate for short term and long term. For example, the salary growth can be assumed to be 10% p.a. for next 3 years of projection and 8% p.a. thereafter. As indicated above, 3 NSE 50 companies (Asian paints Limited, Hero MotoCorp Limited and Dr. Reddy's Laboratories Ltd.) have adopted this approach as at 31 March 2018.
This approach has the advantage of reflecting the currently higher (or lower) actual salary growth rates as well as the structural view of the Company over the long term. This approach also tends to help build consensus with the auditors who may be challenging the salary growth rate assumption based on the actual salary growth rates awarded over the last two to three years.
You can refer to one of our earlier articles on this approach by clicking on the following link:
http://www.kpac.co.in/kc/12/salary-growth-rate-varying-by-year-of-projection.html
Â
- Varying Salary Growth Rate by category of employees:
In this case, the salary growth rate assumption is varied basis the category of employees. For example, employees may be classified as senior management, middle management and non-management employees and a different rate of salary growth may be assumed for each category. As indicated above, 3 NSE 50 companies (Kotak Mahindra Bank Limited, Coal India Limited and Titan Company Limited) have adopted this approach as at 31 March 2018.
Doing so helps the organization in setting a more realistic liability as generally, it is seen that the increase in the salary tends to vary by the category of employees.
Concluding Thoughts
Overall, the average salary growth rate assumption has risen over the years from FY09 before stabilizing between 7.5% to 8% p.a. in the last few years. A stabilization of the salary growth rate assumption could be expected as the economy matures and inflation continues to be benign and stable. However, the year-on-year salary growth rates may vary considerably between industries and companies, depending upon myriad factors. These can be (and, in our view, should be) reflected in the assumption by adopting rates that vary by years of projection and category of employees, as discussed above.
I thank you for reading this note and welcome any comments or recommendations or observations you may have on the subject. You can direct those to the email address mentioned below.
Khushwant Pahwa, FIAI, FIA, B Com (H)
Founder and Consulting Actuary
KPAC (Actuaries and Consultants)
k.pahwa@kpac.co.in
www.kpac.co.in
Disclaimer: The above content has been furnished solely for information and must not be reproduced or redistributed. It should be noted that we are not soliciting any action based upon it. Also, it does not constitute any recommendation. In particular, the information above is for general purposes only and is not an advice on actuarial valuations or investments or anything else. The information given above is in summary form and does not purport to be complete. We have reviewed the above and in so far as it includes information or facts, it is believed to be reliable though its accuracy or completeness cannot be guaranteed. The information contained in the above report should be construed as non-discretionary in nature and the recipient of this material should rely on their own investigations and take their own professional advice. Neither KP Actuaries and Consultants nor any person connected with it accepts any liability arising from the use of this document. The recipient(s) before acting on any information herein should make his/her/their own investigation and seek appropriate professional advice and shall alone be fully responsible / liable for any decision taken on the basis of information contained herein.